不断更新pyplot使用过程中的一些tips,供参考!
可以参考简单示例的demo:
https://matplotlib.org/stable/plot_types/basic/bar.html
科研感很浓的style:
1
plt.style.use('_mpl-gallery')
1. plt.scatter
相关文档:https://matplotlib.org/stable/api/_as_gen/matplotlib.pyplot.scatter.html
1.1 简言之
1
2
3
import matplotlib.pyplot as plt
plt.scatter(X[:, 0], X[;,1]) # 二维散点图
plt.scatter(X[:, 0], X[;,1], X[:, 2]) # 三维散点图
1.2 添加散点颜色
1
2
color = [0,1,2,....,len(X)] # color 可以为列表
plt.scatter(X[:, 0], X[;,1], c=color) # 二维散点图
1.3 改变散点大小
1
plt.scatter(X[:, 0], X[;,1], s=30)
1.4 增加散点名称
如果需要在图中标出每个散点的名称。采用plt.annotate, 假设scatter_name为散点名称列表
1
2
3
plt_name = []
for i, tlt in enumerate(scatter_name):
  plt_name.append(plt.annotate(tlt, X[i], fontsize=6)) # fontsize可以改变字号
在散点较为密集的情况下注释会重合,可以使用adjustText解决matplotlib plt.text()文字重叠问题
参考:https://zhuanlan.zhihu.com/p/360342023
安装adjustText:
1
2
3
pip install adjustText
or
conda install -c conda-forge adjusttext
使用:
上述代码后增加一行
1
adjust_text(plt_name)
2. plt.subplots
1
2
3
4
5
6
7
8
9
10
11
12
13
fig, ((ax1, ax2), (ax3, ax4), (ax5, ax6)) = plt.subplots(3, 2, figsize=(10,15)) # 3行两列,figure size设置图片大小

ax1.boxplot([box_1, box_2, box_3], positions=[2, 4, 6], widths=1.2, patch_artist=True,
                showmeans=False, showfliers=False,
                medianprops={"color": "white", "linewidth": 0.5},
                boxprops={"facecolor": "C0", "edgecolor": "white",
                          "linewidth": 0.5},
                whiskerprops={"color": "C0", "linewidth": 1.5},
                capprops={"color": "C0", "linewidth": 1.5}) # 在第一张分图上更新了箱线图

ax1.title.set_text("E-ACC") # 设置了第一张分图的名称

#plt.subplots_adjust(left=0.05, bottom=0.03, right=0.95, wspace=0.1, top=0.95, hspace=0.15)
2.1 调整分图整体的布局
https://blog.csdn.net/asty9000/article/details/88881499
1
plt.subplots_adjust(left=0.05, bottom=0.03, right=0.95, wspace=0.1, top=0.95, hspace=0.15)
有六个可选参数来控制子图布局。值均为0~1之间。其中left、bottom、right、top围成的区域就是子图的区域。wspace、hspace分别表示子图之间左右、上下的间距。实际的默认值由matplotlibrc文件控制的。
2.2 调整子图的刻度名称
https://stackoverflow.com/questions/19626530/python-xticks-in-subplots
1
2
plt.setp(axes, xticks=[0.1, 0.5, 0.9], xticklabels=['a', 'b', 'c'],
        yticks=[1, 2, 3])
2.3 设置main title
https://stackoverflow.com/questions/7066121/how-to-set-a-single-main-title-above-all-the-subplots-with-pyplot
1
plt.suptitle('Model Performance on DailyDialog Seen and Unseen Sets', fontsize=15)
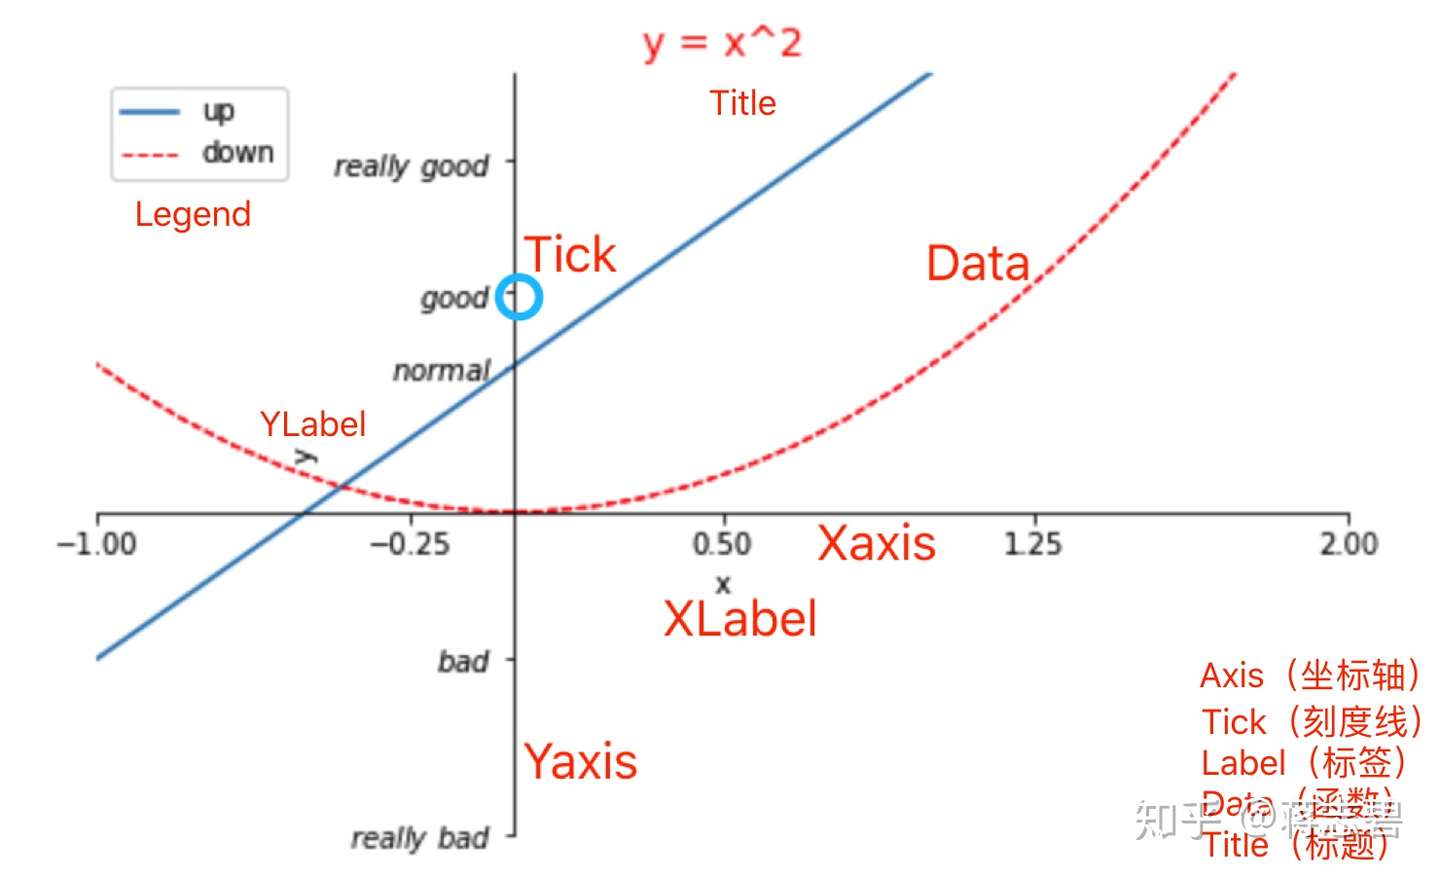
3. Lagend图例
https://zhuanlan.zhihu.com/p/41781440
1
2
3
4
l1=plt.plot(x,y2)
l2=plt.plot(x,y1,color='red',linewidth=1.0,linestyle='--')

plt.legend(handles=[l1,l2],labels=['up','down'],loc='best')
3.1 调整图例大小
https://stackoverflow.com/questions/7125009/how-to-change-legend-size-with-matplotlib-pyplot
You can set an individual font size for the legend by adjusting the prop keyword.
1
plot.legend(loc=2, prop={'size': 6})
4. 配色
几个个人觉得比较高级的配色:
1
color = ["goldenrod", "teal", "#aaa662"]
The 954 most common RGB monitor colors, as defined by several hundred thousand participants in the xkcd color name survey. (查配色):
https://xkcd.com/color/rgb/